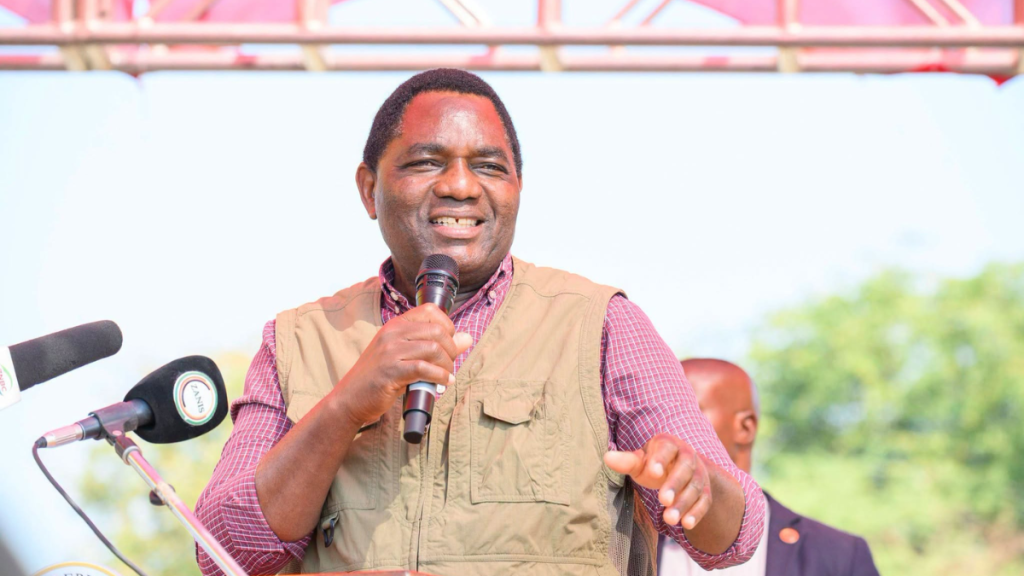
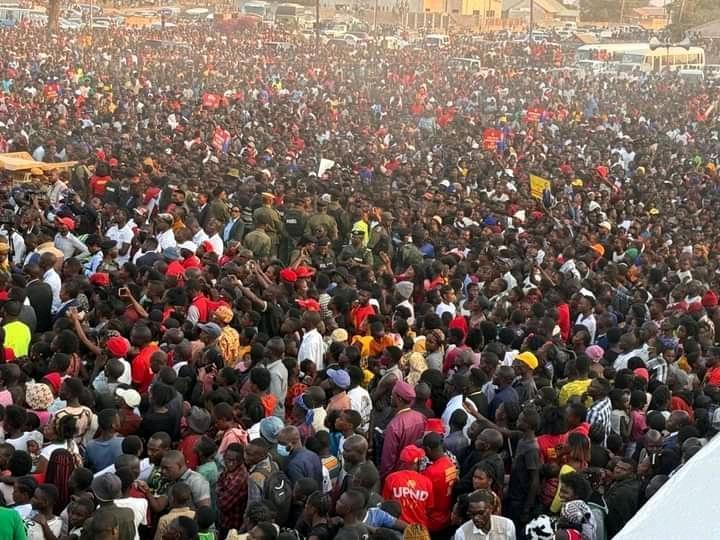
Every campaign season produces the same photograph: a stadium at capacity, a road closed by bodies, a candidate raising both arms above a sea of party colours. And every campaign season, the same claim follows the photograph — look at the crowd, the election is already decided.
It is a testable claim. This piece tests it using electoral data rather than adjectives, and it grades no party. The arithmetic below applies identically to whoever is holding the microphone.
Start with the arithmetic
On 4 May 2026 the Electoral Commission of Zambia certified the register that will decide the 13 August poll: 8,786,300 registered voters. Of those, 4,665,431 are women (53.1%), 4,120,869 are men (46.9%), 4,066,423 are classified as youth (46.3%), and 20,162 are persons with disabilities.
That register is the entire universe of people who can legally affect the outcome. Everyone else — however loud, however visible — is a spectator.
Apply the 2021 turnout rate of 70.61% and roughly 6.2 million ballots will be cast. After rejected ballots, valid votes land near 6.05 million. To win outright in the first round under the 50% + 1 rule, a candidate needs about 3.02 million votes.
Three million ballots. Roughly one in seven Zambians. That is the number every rally is ultimately competing for.
What a rally actually is, in economic terms
Strip away the drums and a rally is a signalling exercise with an unusual cost structure.
For the campaign, the marginal cost of an additional attendee is close to zero once the venue, stage, sound and security are paid for. That is why rallies are attractive: the fixed cost is high, but the visual output scales for free.
For the attendee, the cost is real and personal — transport fare, a lost day of trading or piecework, food, and hours in the sun. Economists would call attendance a costly signal: people rarely pay to attend something they are indifferent about.
The problem is what that signal actually measures. A crowd is a reliable indicator of enthusiasm among people who chose to attend. It is not a random sample of the electorate, and it was never designed to be one.
Three reasons crowd size is a biased estimator
1. Self-selection
Committed supporters travel. Undecided voters stay home. Opposition-leaning voters certainly stay home. A rally therefore samples the most motivated tail of a candidate’s support and tells you almost nothing about the median voter — who is precisely the voter that decides close elections.
2. Attendance is not always voluntary or unpaid
This is uncomfortable but well documented across the region. Reporting on Nigeria’s 2023 campaign noted plainly that crowds at rallies can be hired. Transport is provided, allowances change hands, and the same supporters can be moved between venues. A crowd financed by the campaign is a measure of the campaign’s logistics budget, not of its vote bank.
3. Geography — the wasted-margin problem
This is the one economists find most interesting. Under a national threshold system, a vote is worth exactly the same wherever it is cast, but enthusiasm concentrates geographically. A candidate can assemble enormous crowds in their strongest areas and simply run up margins they already had.
Nigeria’s 2023 presidential election is the textbook illustration. Peter Obi drew crowds that convinced many observers he would win. He finished third with roughly 25% of the vote. In his home state of Anambra he polled 584,621 votes against Bola Tinubu’s 5,111 — a spectacular margin that was worth precisely one state. Tinubu won nationally with about 8.8 million votes and 36.6%. Obi’s crowds were real. They were also concentrated in the wrong place, and among a demographic with lower registration and turnout than the average.
What the research actually finds
The academic literature does not say rallies are worthless. It says the effect is small, local and short-lived, and that it works mainly through mobilisation rather than persuasion.
| Study | Setting | Finding |
| Snyder & Yousaf (NBER, 2020) | US presidential rallies, 2008–2016 | Trump rallies produced a short-lived rise in support, stated intention to vote and small donations; no consistent, robust effect for other candidates |
| Truman whistle-stop tour, 1948 | US county-level data | Roughly 3 percentage points gained in counties visited — the high-water mark in the literature |
| J-PAL field experiment | Philippines | Deliberative town halls did not raise turnout but did raise vote share by changing attitudes |
| Door-to-door canvassing experiment | US local race | About 3 points on candidate vote share, 6 points on margin |
Read that table carefully. The largest documented effects come from one-to-one contact, not mass gatherings. The rally effects that do show up are measured in days, not months, and they concentrate among people who were already leaning the candidate’s way.
Notably, the Snyder and Yousaf study found that local media coverage rose around every candidate’s rallies — so the volume of coverage alone did not explain the difference in outcomes. Something other than visibility was doing the work.
The Zambian evidence
Zambia has run this experiment three times with the same candidate.
Michael Sata was, by any measure, a drawer of crowds. Former PF secretary general Wynter Kabimba recounted a rally at Kapiri in the 2006 campaign so large it caused traffic congestion — and where, he says, Sata subsequently polled around 200 votes in the area. Sata lost in 2006 with 29.4% of valid votes. He lost again in 2008 with 38.13%. He won in 2011 with 42.85%.
The crowds were a constant. The results were not.
What changed between 2008 and 2011 was not attendance but arithmetic: a broader coalition, better organisation in areas that were not already his, and a turnout structure that worked in his favour. Sata won in 2011 on a plurality of 1,170,966 votes against Rupiah Banda’s 987,866, on turnout of 53.63%.
The 2021 cycle makes the point even more sharply — and it does so under conditions where mass gatherings were formally discouraged because of COVID-19.
| 2016 | 2021 | Change | |
| Registered voters | — | 7,023,499 | — |
| Turnout | ≈ 56.5% | 70.61% | +14 pts |
| Hichilema votes | 1,760,347 | 2,852,348 | +1,092,001 |
| Lungu votes | 1,860,877 | 1,870,780 | +9,903 |
Hakainde Hichilema won with 59.02% of valid votes and a margin of 981,568. Edgar Lungu’s absolute vote barely moved — he added under ten thousand votes in five years while his share fell 11.61 points.
The 2021 result was not produced by bigger rallies. It was produced by 1.09 million additional ballots arriving from registration growth and a 14-point turnout surge, disproportionately among urban and young voters. That is a mobilisation story, not a crowd story.
Campaign efficiency: cost per marginal vote
Here is where the economics gets practical. Campaign resources are finite. Every kwacha spent on one channel is a kwacha not spent on another, and the relevant question is not “which activity looks most impressive” but which activity delivers the most additional votes per kwacha.
| Channel | Cost structure | What it primarily does |
| Mass rally | High fixed cost; near-zero marginal cost per attendee | Mobilises existing supporters; generates media and morale |
| Door-to-door canvassing | Low fixed cost; high cost per contact | Persuades and mobilises; strongest measured effects |
| Radio, especially vernacular | Moderate fixed cost; very low cost per reach | Reaches rural and non-attending voters |
| SMS and digital | Low fixed cost; low cost per contact | Reminder and turnout effects; skews younger and urban |
| Polling agents | Pure variable cost, per stream | Protects votes already won; no persuasion value |
The last row is the one campaigns underweight. Votes are won at rallies only in a metaphorical sense. They are counted at polling streams — and an uncontested stream is a stream where a campaign has no visibility into its own result. Money moved from a stadium hire to agent coverage does not produce a photograph, but it produces a verifiable tally.
The opportunity cost nobody puts in the budget
Rallies impose costs beyond the campaign’s own ledger.
For attendees, a day at a rally is a day of foregone earnings — significant in an economy where a large share of the workforce is in informal trade and daily-wage work. For businesses along a rally route, road closures and crowd disruption mean lost trading hours. For the state, there are policing and traffic-management costs that are not attributed to any campaign.
None of this is an argument against rallies. Public assembly is a constitutional right and a legitimate feature of democratic competition. It is simply an argument for counting the full cost when assessing whether a channel is efficient. A rally that mobilises 20,000 already-committed supporters at a social cost of tens of thousands of lost working hours is doing something — but it may not be doing the thing the campaign thinks it is.
Businesses planning around this period will find our companion analysis useful: How Zambian Businesses Should Plan for the Election Period.
What actually moves votes: economic conditions
The most robust finding in the political economy of elections is not about campaigns at all. It is the economic voting literature: across a wide range of countries and decades, incumbent performance at the ballot box correlates with economic conditions in the year or two before the vote — particularly with inflation, employment and household purchasing power.
Voters behave retrospectively. They are far better at answering “am I better off than I was?” than at evaluating manifesto commitments they will never see costed.
Zambia’s macro picture entering this election is, on the aggregate numbers, favourable. GDP grew 7.7% in the first quarter of 2026, against 4.5% in the same quarter of 2025. Annual inflation has decelerated sharply — from 11.2% in December 2025 to 7.5% in February, 7.1% in March, and roughly 6.5% by mid-year, back inside the Bank of Zambia’s 6–8% target band and around the lowest readings since 2018. Food inflation stood at 6.7% in June 2026.
But here is the asymmetry that matters, and it cuts against easy conclusions in either direction: disinflation is not deflation. A fall in the inflation rate means prices are rising more slowly, not that they have come down. A household that watched the cost of mealie meal, transport and electricity climb steeply over several years does not experience 6.5% inflation as relief. It experiences a permanently higher price level.
This is the gap between the aggregate statistic and the lived one, and it is where elections are actually decided. It is also why economic conditions predict election outcomes better than crowd photographs do — and why they do so imperfectly.
For a fuller treatment of the fiscal position, see What the Next Government Inherits: Zambia’s Economic Position on 14 August 2026 and The Economics of Election Promises.
Five indicators worth more than a crowd photograph
- The certified register by province and constituency. Where the 8,786,300 voters actually sit determines where votes are available to be won. This is published data and every serious campaign is already modelling it.
- Polling agent coverage. A campaign’s agent deployment across polling streams is a better proxy for organisational capacity than any rally.
- Turnout differentials, not turnout levels. National turnout matters less than the gap between turnout in a candidate’s strong areas and their weak ones.
- By-election and local government trends. Small, low-salience contests reveal organisational reach in a way that national campaign events do not.
- Polling with published methodology. Sample size, sampling frame, field dates and margin of error. A poll that will not disclose these is a press release, not evidence.
What this analysis does not claim
Three honest qualifications.
First, rallies are not merely theatre. They generate free media coverage, they signal viability to donors and potential defectors, and they sustain the morale of the volunteers who do the unglamorous work. A campaign that abandoned public gatherings entirely would lose something real.
Second, the causal literature is thinner in African electoral contexts than in the United States, where most of it was produced. Party systems, media environments and the role of in-person contact differ. Applying US point estimates to Lusaka or Kitwe requires caution.
Third, the relationship can run both ways. Rising support produces bigger crowds as easily as bigger crowds produce rising support — which is exactly why crowd size is a poor tool for prediction. It may be reflecting a trend rather than creating one, and from a photograph you cannot tell which.
The conclusion the arithmetic forces
Crowds are a genuine measure of something. They measure enthusiasm, they measure a campaign’s ability to organise logistics at scale, and they measure visibility. All three are worth having.
What they do not measure is votes.
On 13 August, between 06:00 and 18:00 hours, the outcome will be determined by a specific and knowable set of people: those among the 8,786,300 on the certified register who present themselves at a polling stream, mark a ballot, and have it counted as valid. Roughly three million of those ballots, cast for one candidate, ends the contest in the first round.
A stadium seats forty thousand. The register holds nearly nine million. The distance between those two numbers is the distance between a photograph and a result.
Elections are not won by the people who show up to listen. They are won by the people who show up to vote.
The Zambian Economist publishes independent, data-led analysis of Zambia’s economy and public finances. This article is part of our Election 2026 Economics series and takes no position on any party or candidate.