
Annual inflation has fallen to about 6 per cent, but prices are 2.29 times their January 2020 level. Slower price growth has not given households back what they lost.
Zambians are paying far more for the same goods than they did in 2020, even though inflation has slowed sharply. The all-items consumer price index (CPI) stood at 564.62 in October 2026, against 246.72 in January 2020. Rebased to January 2020 = 100, that is 228.9. Income that has not more than doubled since 2020 now buys less.
Annual inflation peaked at 24.6% in June 2021 and fell to 6.1% in September 2026, its lowest since February 2018, before edging up to 6.3% in October, according to the Zambia Statistics Agency (ZamStats). That is good news, and easy to misread. A lower inflation rate means prices are rising more slowly. It does not mean they are falling.
This analysis uses monthly ZamStats CPI data from January 2020 to October 2026, Bank of Zambia exchange rates and the Jesuit Centre for Theological Reflection (JCTR) Basic Needs and Nutrition Basket to separate the inflation rate from the price level, and to test what the accumulated rise means for a household on a fixed salary.
Is inflation down or are prices down?
Inflation is down. Prices are not. Headline inflation fell from 11.9% in October 2025 to 6.3% in October 2026, a drop of 5.6 percentage points, yet the index kept rising every month. Economists call this disinflation. Deflation, a fall in the price level, has not happened.
The table chains each year’s December-on-December inflation rate into a price index, and shows the income needed to buy what K1,000 bought at the end of 2019.
| Year-end | Annual inflation (Dec/Dec) | Price index (Dec 2019 = 100) | Income needed |
|---|---|---|---|
| 2019 | n/a | 100.0 | K1,000 |
| 2020 | 19.2% | 119.2 | K1,192 |
| 2021 | 16.4% | 138.7 | K1,387 |
| 2022 | 9.9% | 152.5 | K1,525 |
| 2023 | 13.1% | 172.5 | K1,725 |
| 2024 | 16.7% | 201.3 | K2,013 |
| 2025 | 11.2% | 223.8 | K2,238 |
The biggest steps came in 2020 and 2024, at 19.2% and 16.7%. The 2024 jump followed the drought that cut the maize harvest. As a cross-check, the year-end chain reaches 2.24 times its December 2019 level by December 2025, close to the 2.29 times recorded by the official monthly CPI by October 2026. The small rise from 6.1% to 6.3% in October is a reminder that the downward path is not guaranteed.
Why food hurt more
Food prices rose much faster than everything else. Between January 2020 and October 2026 the food CPI rose about 154.5%, against 98.8% for non-food items.
| Measure | Oct 2026 (Jan 2020 = 100) | Cumulative change | Annual rate, Oct 2025 | Annual rate, Oct 2026 |
|---|---|---|---|---|
| All items | 228.9 | 128.9% | 11.9% | 6.3% |
| Food | 254.5 | 154.5% | 14.1% | 5.7% |
| Non-food | 198.8 | 98.8% | 8.7% | 7.4% |
The gap built up year after year. Food inflation ran above the headline rate at every year-end from 2020 to 2025, by between 1.0 and 3.5 percentage points, and the widest gap was in 2021 (19.9% food against 16.4% headline). Compounded over six years, that produces a much larger cumulative rise in food prices.
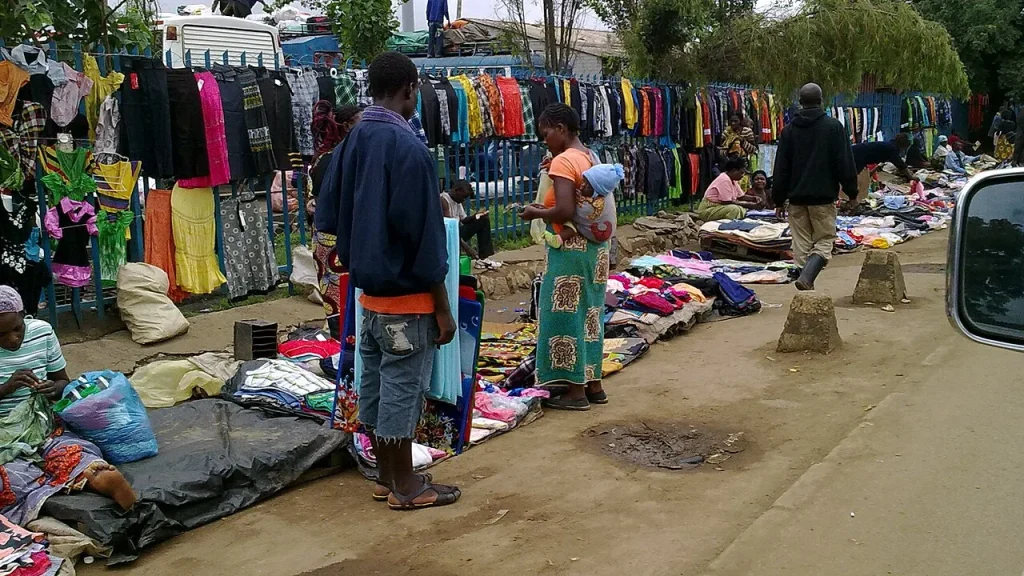
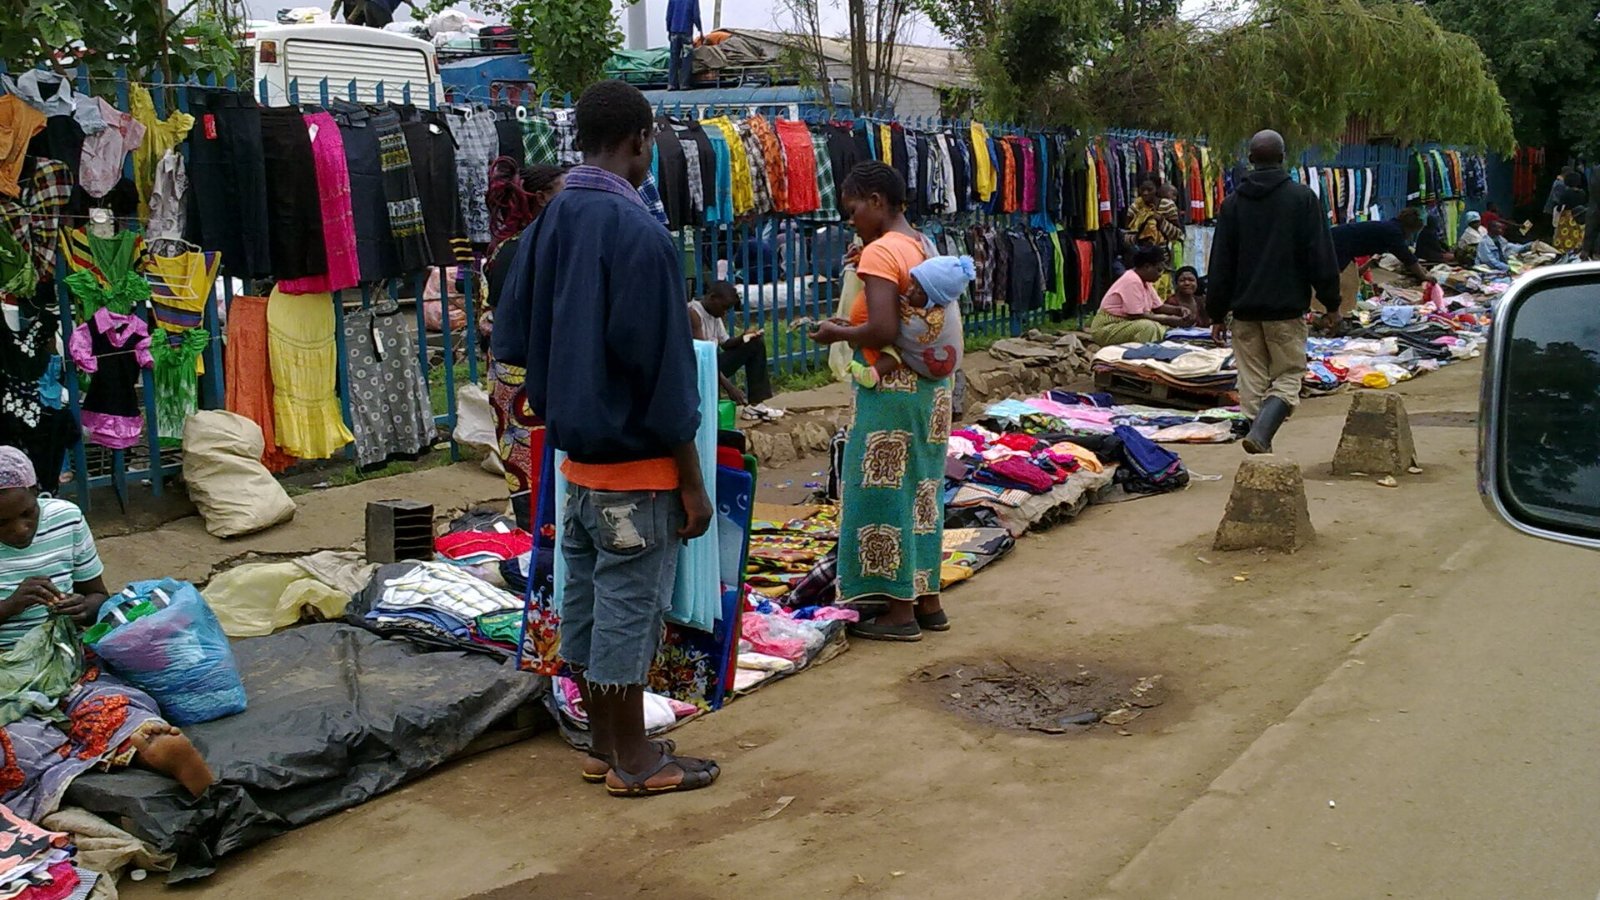
This matters more for poorer and rural households. The 2022 Living Conditions Monitoring Survey found that food took 56.4% of household spending in rural areas and 34.7% in urban areas. CPI weights and household spending shares are not the same thing, but the direction is clear: families who spend more on food carried more of the increase.
The pattern has now flipped. By October 2026 food inflation had slowed to 5.7%, while non-food inflation was 7.4%. ZamStats attributed October’s uptick mainly to non-food items, including fuel, accommodation and road passenger transport. Food is getting more expensive more slowly, but it starts from a level two and a half times higher than in 2020.
Did the stronger kwacha bring inflation down?
It probably helped, but the data cannot prove it. Bank of Zambia figures show the monthly average mid-rate moving from K28.69 per US dollar in March 2025 to K22.84 in December 2025. The quoted rate fell 20.4%, which means the kwacha gained about 25.6% in dollar terms. Inflation fell over the same months.
The link is plausible. A weaker kwacha raises the local cost of imported fuel, fertiliser and goods, and a stronger one can lower it. Studies of Zambia, including Roger, Smith and Morrissey (2019) and Fandamu and others (2023), find that exchange rate pass-through is incomplete and asymmetric: depreciation pushes prices up more than appreciation pulls them down. Harvests, energy prices, monetary policy and administered prices also moved over the same period, and the consistent exchange rate series used here covers only 24 months.
Measuring the kwacha’s effect properly would need a statistical model of monthly inflation against the exchange rate, fuel and food prices from 2020 to 2026, with controls for COVID-19, the 2021 election and the 2024 drought. Until then, shoppers should not expect a proportionate fall in shop prices because the currency is stronger.
What does a family of five need?
The JCTR Lusaka basket prices a set of food and non-food necessities for a family of five. It is a cost benchmark, not a measure of what every household spends.
| Month | Basket cost | Change |
|---|---|---|
| June 2025 | K11,763.38 | Annual baseline |
| January 2026 | K11,365.00 | Start of 2026 |
| June 2026 | K12,112.88 | +K747.88 since January; +3.0% on a year earlier |
| August 2026 | K12,000.94 | Before the September fall |
| September 2026 | K11,399.64 | −K601.30 on August |
The basket rose K747.88 in the first half of 2026 even as annual inflation eased from 11.2% to 6.5%. The two are measuring different things: the inflation rate compares prices with a year earlier, while the basket records what specific goods cost in a given month. Monthly swings can be large. JCTR put September’s K601.30 fall mainly down to cheaper vegetables, bananas, kapenta, Irish potatoes and roller mealie meal.
How much has a civil servant’s salary lost?
About 30% of its real value since January 2020, on the assumptions below. Take a civil servant earning K13,000 a month gross, treated as basic pay of about K10,833 plus a transport allowance of 20% of basic. Working backwards through the recorded pay awards (8% in 2021, 12% in 2022, 10.5% in 2023, then flat increases of K550 in 2024, K500 in 2025 and K700 in March 2026), basic pay was about K6,796 at the end of 2019, with no change assumed in 2019 or 2020.
By October 2026 basic pay is 59% above its January 2020 level. Prices are 129% higher. Real pay stands at about 69.6 on a January 2020 base. This is an illustration built on stated assumptions, not a finding about every worker.
Set against the JCTR basket, the margin is thin:
| Pay measure | Monthly pay | June 2026 basket (K12,113) | September 2026 basket (K11,400) |
|---|---|---|---|
| Gross pay | K13,000 | 93% | 88% |
| Take-home, upper estimate | K10,000 | 121% | 114% |
| Take-home, lower estimate | K7,300 | 166% | 156% |
Many households have more than one earner or fewer than five members, so this is not a poverty line. It does show that a single K13,000 salary roughly covers a basic basket before deductions, and that take-home pay falls short of it.
What this means for pay talks and policy
Slower inflation stops the erosion getting worse. It does not undo it. Workers, pensioners and informal traders whose incomes have not kept up still carry the cost of earlier price rises, and those who spend most on food and transport have the least room to cut back.
The flat kwacha awards of 2024 to 2026 gave lower-paid staff a larger percentage rise than senior ones, but K550, K500 and K700 are small against a price level that has more than doubled. Pay settlements would be better judged against the income needed to keep a stated base year’s living standard than against the latest annual inflation figure.
For policymakers, the question is whether household incomes can catch up with the accumulated cost of essentials, not only whether inflation has returned to single digits. Tracking inflation alongside wages, household spending and basic-needs baskets gives a fuller picture. Investment in grain storage, transport and market access would reduce the food price swings that hit the poorest households hardest.
Disinflation is a real step towards stability. Restoring lost purchasing power will take sustained price stability, reliable food supply and growth in real incomes.
Sources
- Zambia Statistics Agency, The Monthly, Vol. 283 (October 2026) and Vol. 256 (July 2024)
- Zambia Statistics Agency, 2022 Living Conditions Monitoring Survey Report
- Bank of Zambia, Statistics Fortnightly, Vol. 33, Issue 2
- JCTR, June 2025, June 2026 and September 2026 Basic Needs and Nutrition Basket statements
- Roger, L., Smith, G. and Morrissey, O. (2019), Exchange rate and inflation dynamics in a resource-rich setting: the case of Zambia, South African Journal of Economics
- Fandamu, H. and others (2023), Asymmetric exchange rate pass-through to consumer prices: evidence from Zambia, Foreign Trade Review
- Chipili, J. M. (2022), Inflation dynamics in Zambia, AERC Research Paper 484

Related coverage
WARNING! All rights reserved. This material and all other digital content on this website may not be reproduced, published, broadcast, rewritten, or redistributed, in whole or in part, without the prior express permission of The Zambian Economist. Where permission is granted, the content must be clearly credited to “The Zambian Economist,” with “www.zambianeconomist.com” prominently displayed.
WhatsApp: +260775574228 | Email: info@zambianeconomist.com
© 2026 The Zambian Economist.