By Zambian Economist Analyst
Zambia in 2026 is a genuinely difficult economy to read, because the headline numbers are good and the structure underneath them has not changed much.
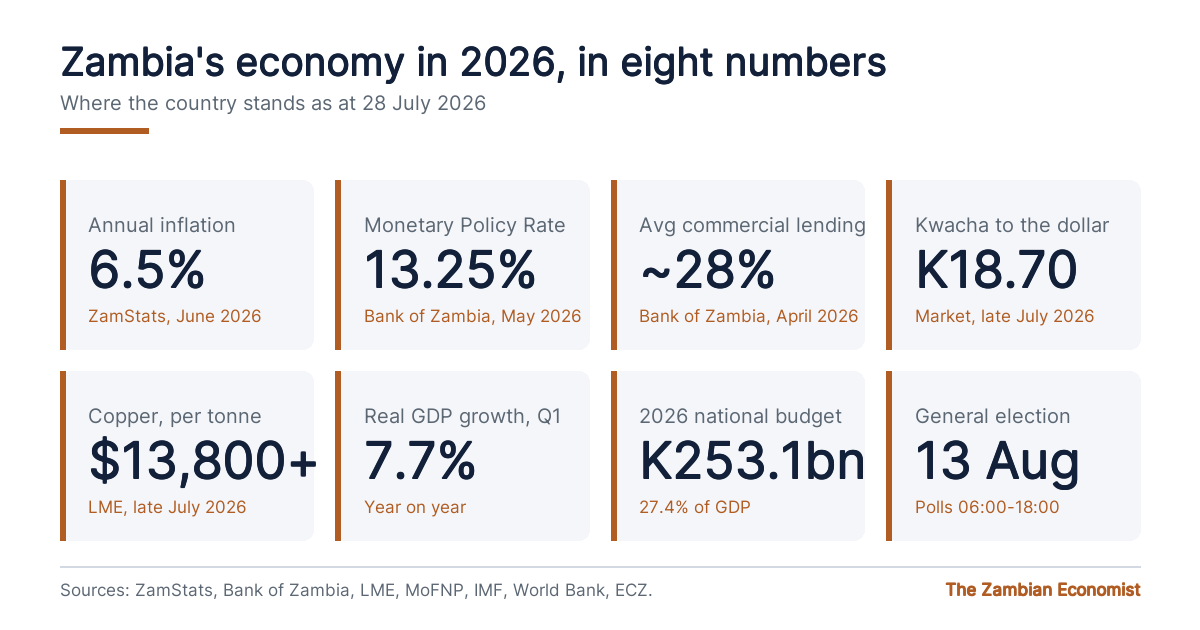
Inflation is back inside the Bank of Zambia’s target band for the first time since 2019. The kwacha is at multi-year highs. Copper is trading close to record levels. The country has just executed a debt transaction no other government had attempted. Growth in the first quarter was 7.7%.
And almost every one of those wins traces back to two things Zambia does not control: the price of copper and the amount of rain that fell last season.
That is not pessimism. It is the actual shape of the problem, and it is why a business owner reading only the headlines will make worse decisions than one who understands the mechanism underneath them.
This hub brings together our analysis of the eight numbers that matter most this year. Each piece is written to be read on its own, in plain English, by someone who has a business to run rather than an economics degree to defend.
Where the economy stands today
| Indicator | Latest | Source |
|---|---|---|
| Annual inflation | 6.5% | ZamStats, June 2026 |
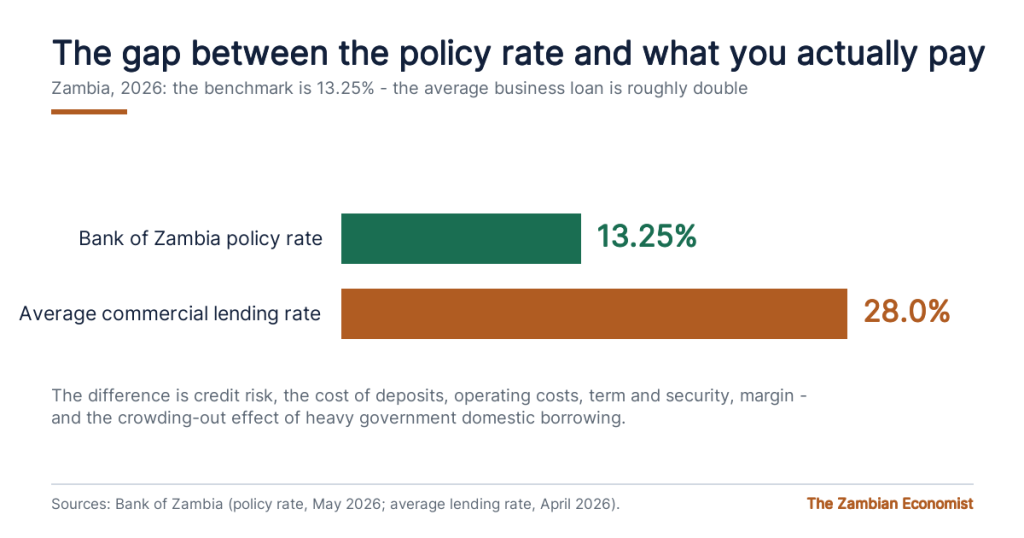
| Monetary Policy Rate | 13.25% | Bank of Zambia, May 2026 |
| Average commercial lending rate | ≈ 28% | Bank of Zambia data, April 2026 |
| Kwacha / USD | ≈ K18.70 | Market, late July 2026 |
| Copper (LME 3-month) | ≈ US$13,800–14,000/t | LME, late July 2026 |
| Real GDP growth, Q1 2026 | 7.7% y/y | Official data |
| 2026 growth forecast | 4.3% (IMF) / 3.8% (World Bank) | IMF, World Bank |
| 2026 national budget | K253.1bn (27.4% of GDP) | MoFNP, September 2025 |
Start here
Zambia Inflation Rate 2026: What the Numbers Actually Show
Inflation fell from 11.2% in December to 6.5% in June. We break down what drove it, which parts are temporary, and what it means for pricing.
Copper and the Kwacha: How the Link Actually Works
The single most important relationship in the Zambian economy, explained without jargon. If you read one piece here, read this one.
Why a Strong Kwacha Is Not Always Good News for Zambia
A rising currency lowers inflation and cuts import costs — and quietly compresses export earnings and the government’s revenue base. Both are true.
What the Bank of Zambia Policy Rate Means for Your Loan
The policy rate is 13.25%. The average lending rate is around 28%. Here is why the gap exists and what actually moves your repayment.
Zambia’s Debt-for-Energy Swap Explained
Zambia bought back a US$1.36 billion bond and committed the interest savings to the electricity grid. A world first — and not without critics.
Zambia’s Power Deficit and the Real Cost to Business
The deficit peaked at 1,600MW and load shedding reached twelve hours a day. Supply is better now. The costs it imposed have not been repaid.
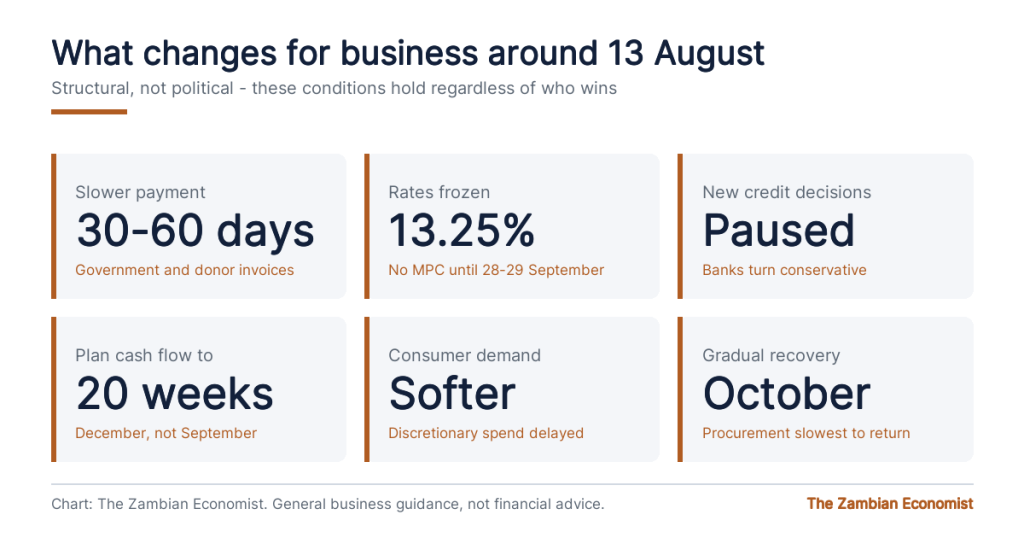
How Zambian Businesses Should Plan for the Election Period
Practical, non-partisan planning for the weeks around 13 August — cash flow, stock, staffing, procurement and credit.
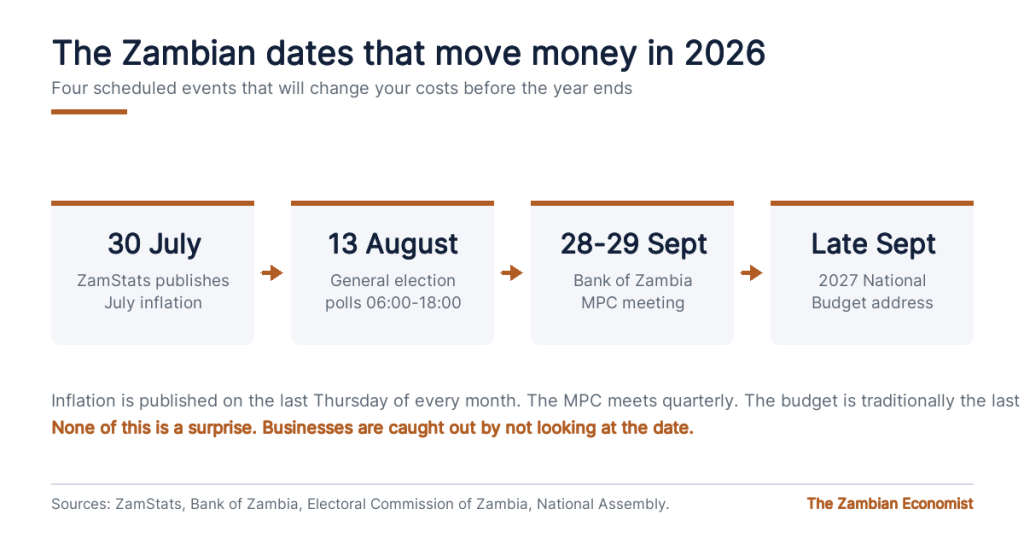
Zambia Economic Calendar 2026: Every Date That Moves Money
MPC meetings, inflation releases, the budget, election day. Bookmark it.
How to use this
If you import, start with the kwacha pieces. If you borrow, start with the policy rate. If you manufacture or process, start with power. If you are planning the next quarter, start with the calendar.
And if you take one idea from this hub, take this one: Zambia’s good numbers in 2026 are real, but they are borrowed from a copper cycle and a good rainy season. The work — for government and for business alike — is building something that survives when both turn.
Figures current as at 28 July 2026. Nothing here is investment advice.
Primary sources: Bank of Zambia · Zambia Statistics Agency